How to Analyze Your Decisions
As previously mentioned, one of the main benefits of having a decision journal is to improve your decision making ability. In order to do that, however, you need to be able to identify patterns of errors or mistakes in your decision making. Our guide on using tags and search is one example for how you can use the Decision Journal app to identify these patterns.
But we also have a complete section of the app that’s dedicated to helping you identify your strengths and weaknesses in your decision making, so that you can improve. To check out this part of the app, simply tap on the chart icon in the bottom navigation bar.
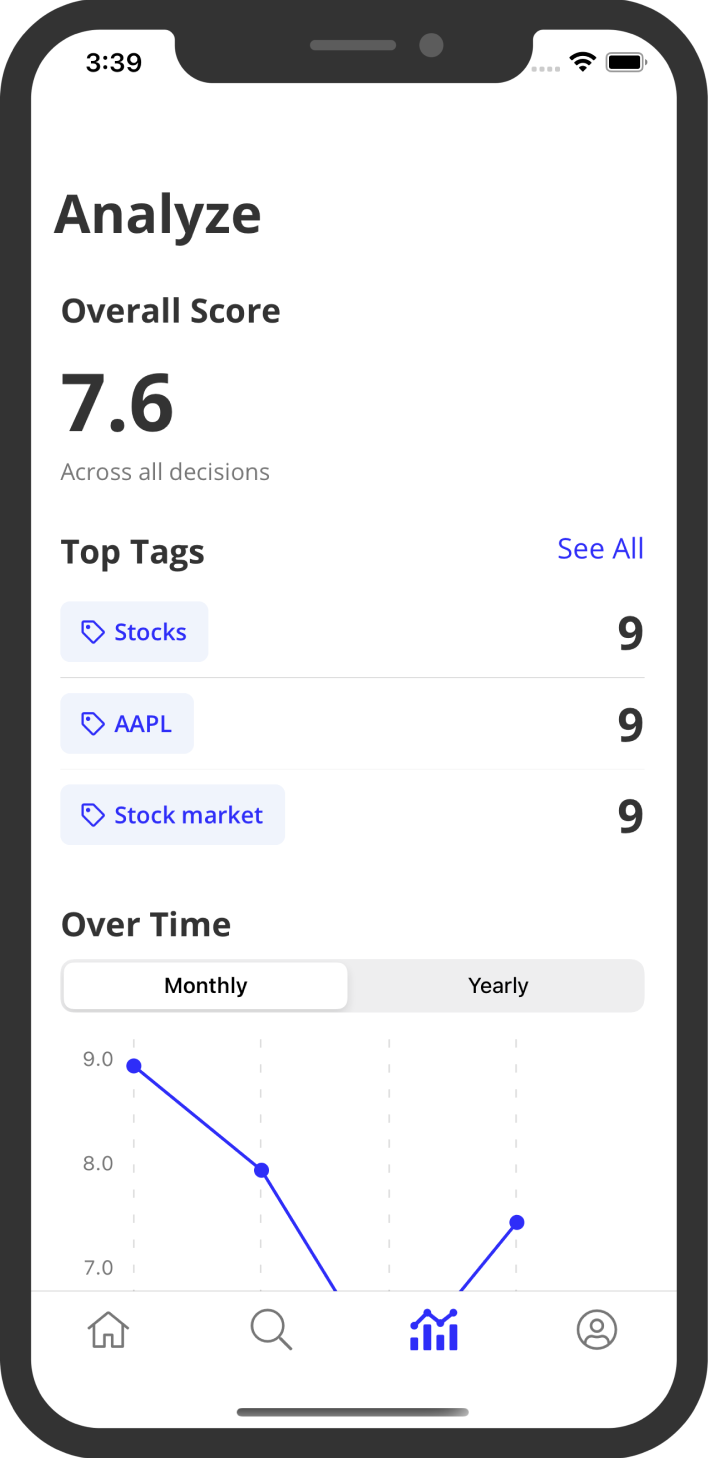
This will take you to the app’s Analyze screen. Here, you can find your overall score across all your decisions (the score at the top most part of the screen). This score is an average score for every decision that you have reviewed.
You shouldn’t think of it as a grade for a test, but rather as a temperature reading for your decision making at any point in time. Also, remember that this score is self-graded. So be aware of inflating your review scores to bring this score up. Also, don’t compare your scores to others since they are on different scales. A score of 5 for one person might be a very good score, whereas for someone else, it may be a low score.
Below your overall score, you’ll find your top tags (ordered by the average score for decisions with that tag). This gives you a quick glance at the decisions your performing best in to help you recognize what categories of decisions you are excelling in. To see a full list of scores for all your tags, just tap the See All button next to the Top Tags header.
Finally, below your top tags, you’ll find a graph of your scores over time. This is meant to give you an idea of trends on your decision making. You can organize scores by Month or Year, as well as filter scores by some of your top tags.
In addition to the main Analyze screen, we’ve also added a few other updates to help you analyze your decision making. The first is that you can get more details into any tag with scores, just by tapping on that tag’s score row. This will show you a more detailed view with the tag’s overall score, as well as a graph of scores for that tag over time, similar to the main Analyze screen.
The other update that we made was in adding overall scores and graphs of scores over time to each decision’s view. These will show up right above the decision’s reviews (once you’ve added at least one review).
We hope that these updates help you understand patterns of errors or mistakes in your decision making and help you become a better decision maker.
For more information on other parts of our app, check out our other guides below:
Happy decision making!